
Westside Colorado Springs Market Pulse: What the Last 6 Weeks of Data Really Say (ZIP by ZIP)

Hi friends — thanks for staying connected. Since you already know me, I’ll skip the hype and get straight to what’s useful: what the newest Westside charts show, what it means for real people, and how I’d use it if you were buying, selling, or just keeping tabs on your equity.
These charts cover weekly snapshots from Dec 2 through Jan 7 across 80904, 80905, 80906, 80907, and 80919, with a Colorado Springs baseline included for context.
Quick takeaways (read this first)
Based on the charts you’ll see below:
-
Citywide inventory fell from ~1,870 to ~1,555 active listings (down ~315 in ~6 weeks).
-
Citywide price reductions eased from 53% to 45% of listings.
-
Westside is not moving as one market: some ZIPs show rising list prices and longer DOM, while others show falling list prices and fewer reductions.
If you only remember one thing: pricing and strategy matter more than “the market.” The ZIP you’re in (and the price band) is doing a lot of the work right now.
Median list price: where Westside pricing is holding vs shifting
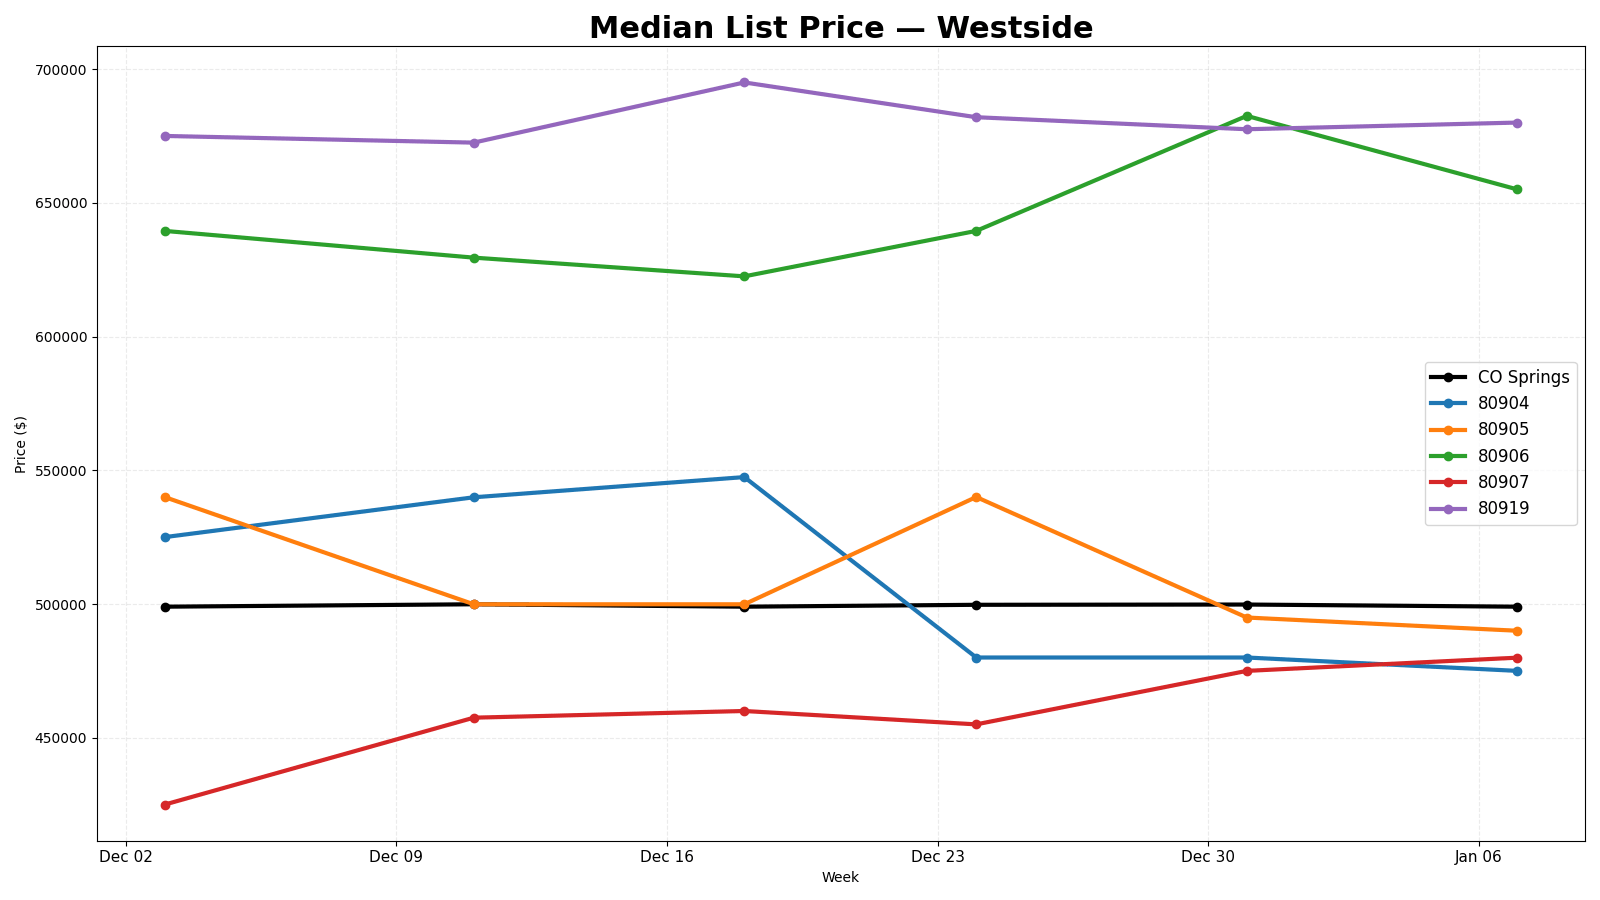
As you can see in the chart, the Colorado Springs baseline stayed essentially flat around ~$499K across the period, while Westside ZIPs moved quite a bit.
Westside ZIP highlights (median list price)
-
80919: roughly $675K → $680K, with a peak near $695K mid-period.
-
80906: roughly $640K → $655K, spiking to about $682K around late December.
-
80907: roughly $425K → $480K (a notable upward move over the period).
-
80905: roughly $540K → $490K (with a bounce back to ~$540K around late December).
-
80904: roughly $525K → $475K after peaking near $547K mid-December.
What I take from this: Westside pricing is behaving in “micro-markets.” Even within a few miles, the list-price story can be completely different.
Helpful context (especially for non-data-nerds): this is median list price (not closed sales), and weekly medians can swing with smaller sample sizes—so we look for direction and consistency, not perfection.
Inventory: fewer choices overall (and tightest in some Westside ZIPs)
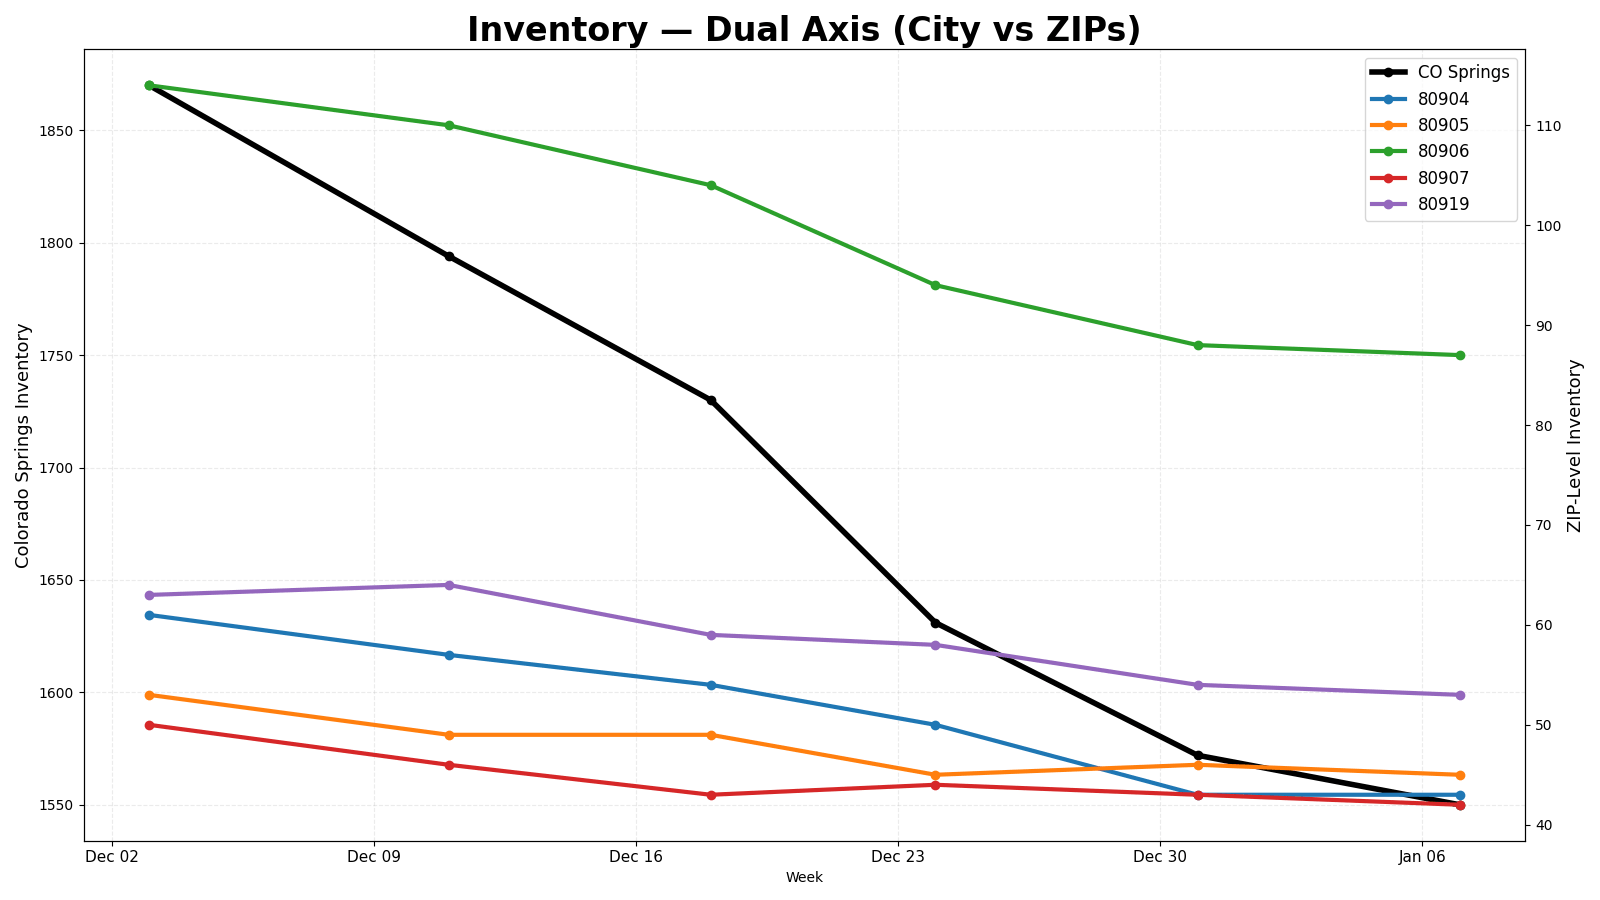
Citywide inventory dropped from ~1,870 active listings to ~1,555 over the period — that’s a meaningful tightening in available homes.
On the ZIP side (right axis of the chart), Westside inventory also drifted down:
-
80906: about 115 → 87 listings
-
80904: about 62 → 43 listings
-
80919: about 64 → 53 listings
-
80905: about 52 → 45 listings
-
80907: about 50 → 42 listings
What this means in real life: even if buyers feel cautious, low/declining inventory can keep “good homes” competitive—especially in the segments people actually want (condition, location, layout).
Days on market: speed is diverging sharply by ZIP
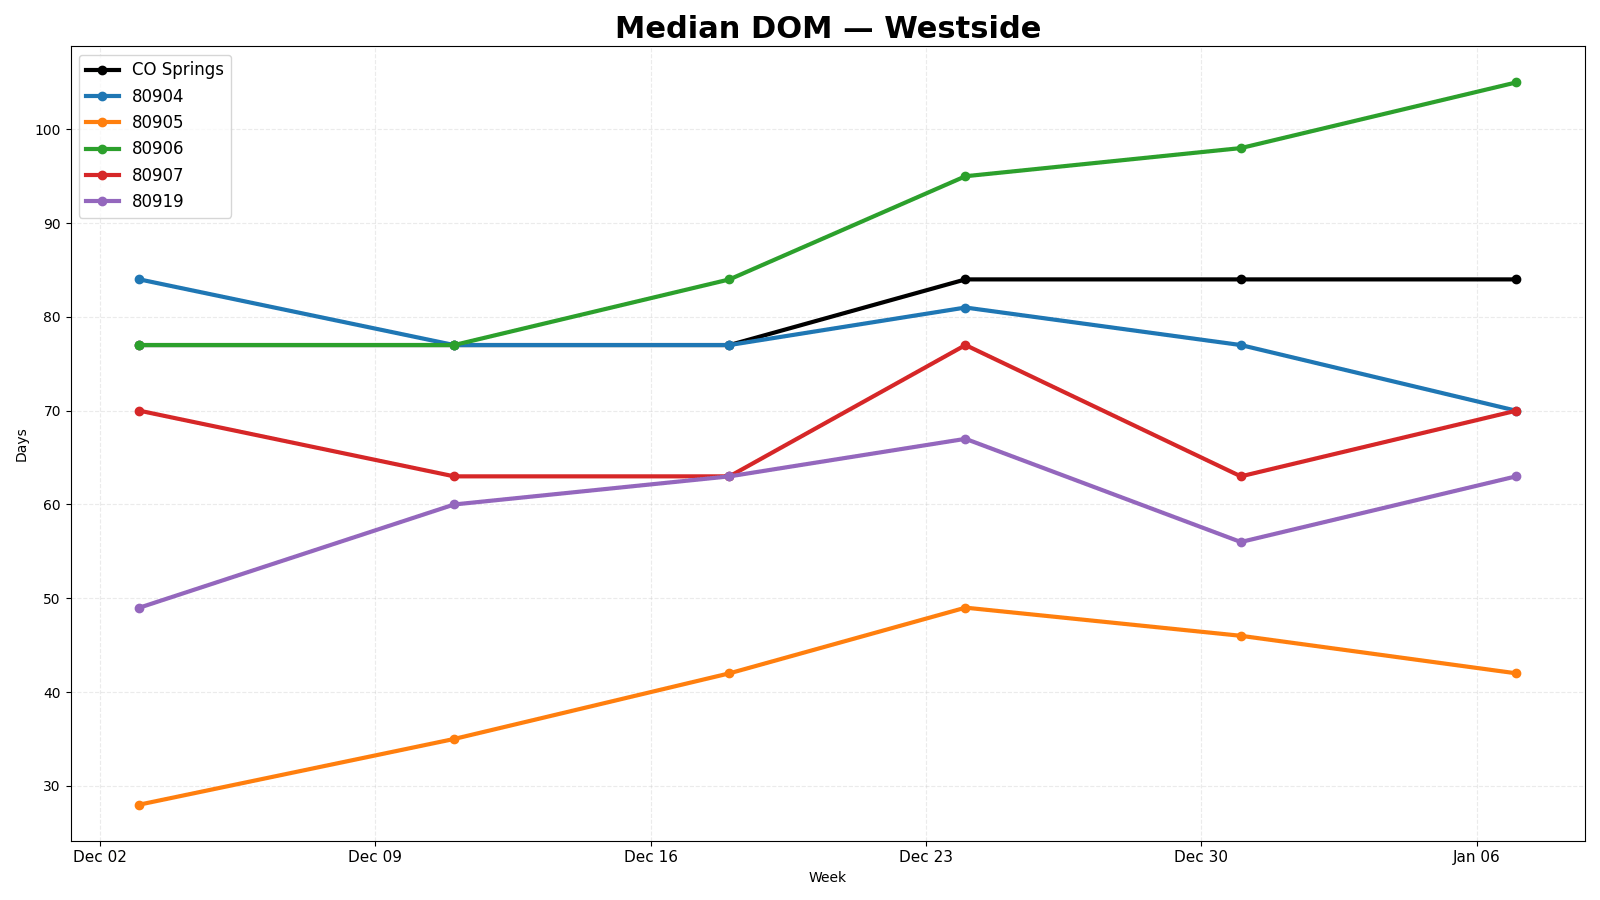
This is one of the most telling charts. Westside timing is splitting into two camps:
Faster / improving
-
80904: about 84 days → 70 days (improving speed by early January)
Slower / stretching out
-
80906: about 77 days → 105 days (gradually lengthening through the period)
-
80919: about 49 days → 63 days (overall longer than early December)
-
80905: about 28 days → 42 days (peaked near 49 late December, then eased)
-
80907: hovered around 63–77 days mid-period, ending near 70 days
City baseline (where shown) moved from ~77 days to ~84 days and then held.
My read: in some Westside pockets, buyers are taking longer to decide—or the available inventory mix is less “move-in ready.” Either way, days on market is a strategy signal: it tells sellers how picky buyers are being right now.
Price reductions: the market is still negotiating—just not evenly
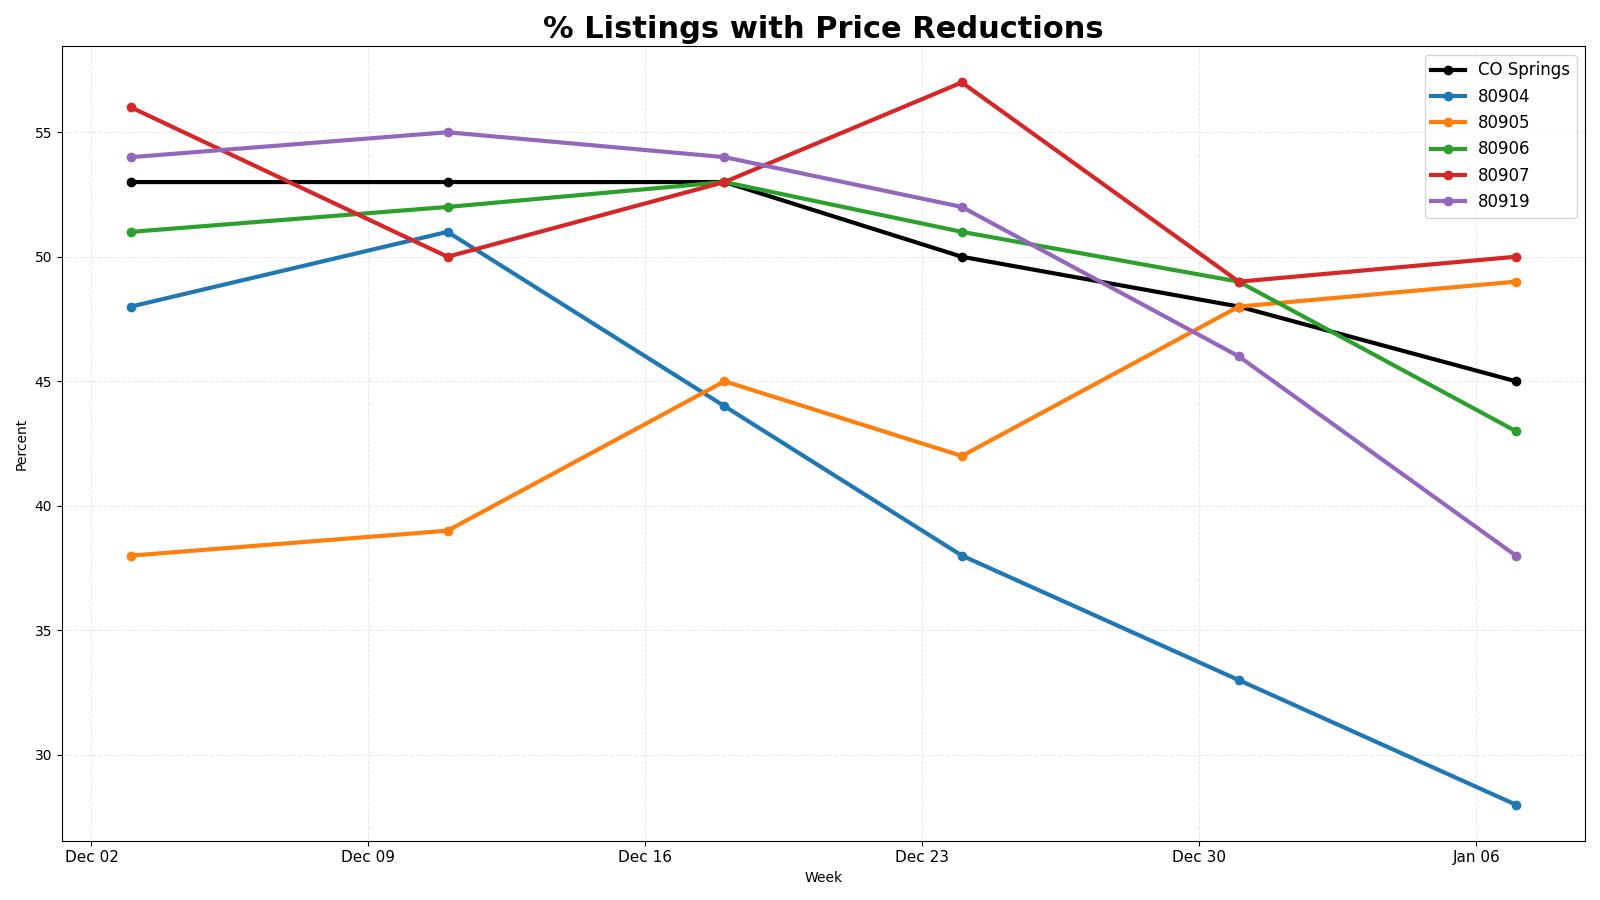
This is the “how much leverage exists” chart.
Citywide, reductions fell from 53% → 45% over the period. That’s fewer listings needing a cut.
But ZIP behavior varies a lot:
-
80904: 48% → 28% (big drop in reductions)
-
80919: 54% → 38% (reductions easing)
-
80906: 51% → 43% (down)
-
80907: 56% → 50% (peaked near 57%, still elevated)
-
80905: 38% → 49% (reductions rising)
How to interpret this (without overthinking it):
-
When reductions are falling (like 80904/80919), it often means pricing is closer to reality or the homes hitting the market are higher quality relative to demand.
-
When reductions rise (like 80905), it often means buyers are pushing back—and sellers need tighter pricing and stronger presentation from day one.
What this means if you’re selling in the Westside
If you want the cleanest outcome (best price + least stress)
Use the charts like a checklist:
-
Look at your ZIP’s DOM trend. If DOM is stretching (ex: 80906), assume buyers are more selective and your home needs a sharper launch plan.
-
Look at your ZIP’s reduction rate. If reductions are high (ex: 80905/80907 recently), the market is telling us: “Price it right early, or expect a correction later.”
-
Anchor to your micro-market, not the city average. Citywide ~$499K tells you almost nothing about how a Westside buyer will respond to a specific home.
What this means if you’re buying (or helping a kid buy) on the Westside
Here’s the practical playbook based on these charts:
-
In ZIPs where DOM is rising and reductions remain common, buyers can often negotiate price, inspection items, and/or seller credits more than they assume.
-
In ZIPs where reductions are falling and inventory is tight, the best homes can still move quickly—so it’s less about “getting a deal” and more about being ready when the right one appears.
The Westside headline (my honest summary)
If you zoom out across all four charts:
-
Inventory is down (citywide and across most Westside ZIPs).
-
Negotiation is still part of the market, but it’s easing in some ZIPs and rising in others.
-
Timing and pricing are ZIP-specific right now—which is exactly why broad “Colorado Springs market” headlines can be misleading.
Want the “your address / your ZIP” version of this?
If you reply (or message me) with your ZIP + rough home type + time horizon, I’ll send you a quick, no-pressure snapshot:
-
what your neighborhood is doing,
-
what buyers are rewarding right now,
-
and what I’d watch over the next 30–60 days.
Categories
Recent Posts


REVIEWS

Dave Brackett
GET MORE INFORMATION